Mathematician/Programmer

University of Sussex 2016-2021
As an Associate Tutor I organized workshops for first and seconf year students.
Heriot-Watt University 2012-2016
Graduated with First Class Honours.
Data Science: NumPy, SciPy, Matplolib, Pandas
Webdev: Django, Flask
Spring, Maven, Gradle
OpenGL
Git, Bash, Cloud Computing(Google Cloud, AWS), HTML&CSS, Rest APIs
Nostalgia driven projects of recreating the old version of Minesweeper as closely as possible (at least in terms of functionality) in PyGame.
Library for solving fully non-linear PDE Solver based on FEniCS library developed during my PhD.
Simple webapp giving access to basic statistics and graphs visualising infection rates of Coronavirus around the world.
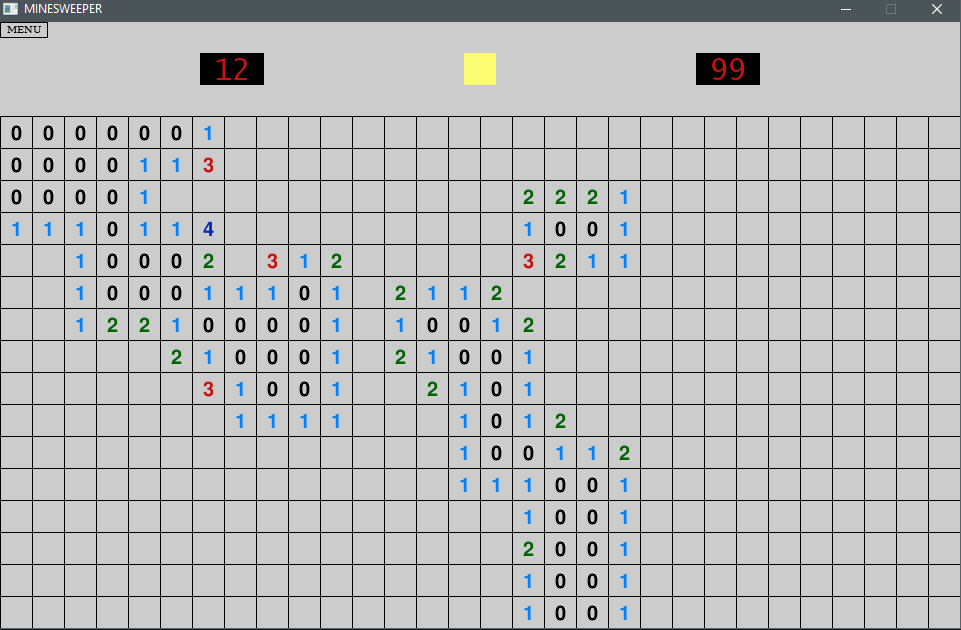
Who of us have not spent hours trying to slice seconds of their personal best score in Minesweeper? Well, I know I have. But the newer versions of Minesweeper were just missing the charm of the old version so I decided to create a worthy tribute to my memories.
The implementation is as simple as it gets. You can choose difficulty level and check your high scores. That's it. From the mechanical point of view I tried to get as as close to the original version as possible. Visuals were not prioritized although in a sense they reflect the rough charm of the original version.
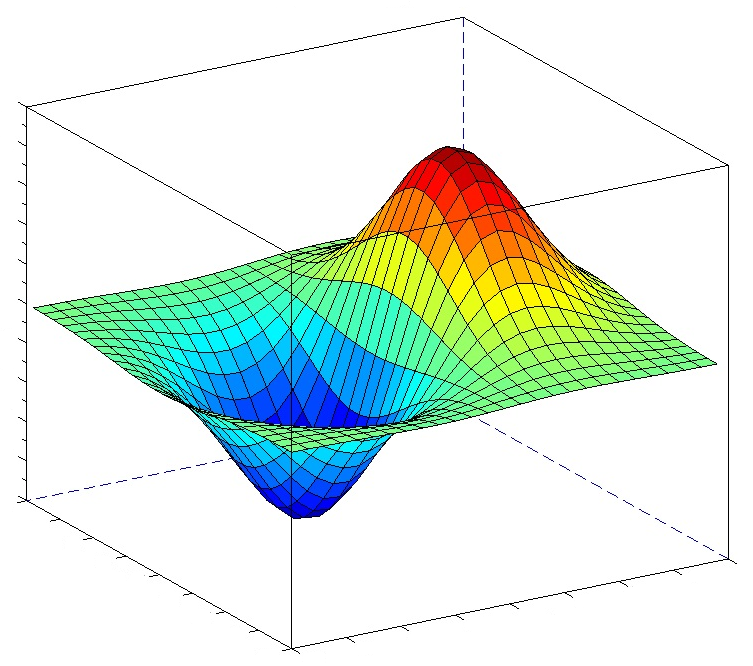
This project is result of my research as a PhD student. This is a demo of a fully nonlinear PDE solver based on the FEniCS Project. In simple words it allows to visualize solutin to partial differential equations. I address the next paragraph to those more mathematically inclined.
FEISol was designed for solving Isaacs problems with general Dirichlet boundary conditions and Hamilton-Jacobi-Bellman problems with general mixed boundary conditions using FEM with P1 elements. This solver is suitable for problems in non-divergence form, including those with degenerate diffusion and posed on nonconvex domains.
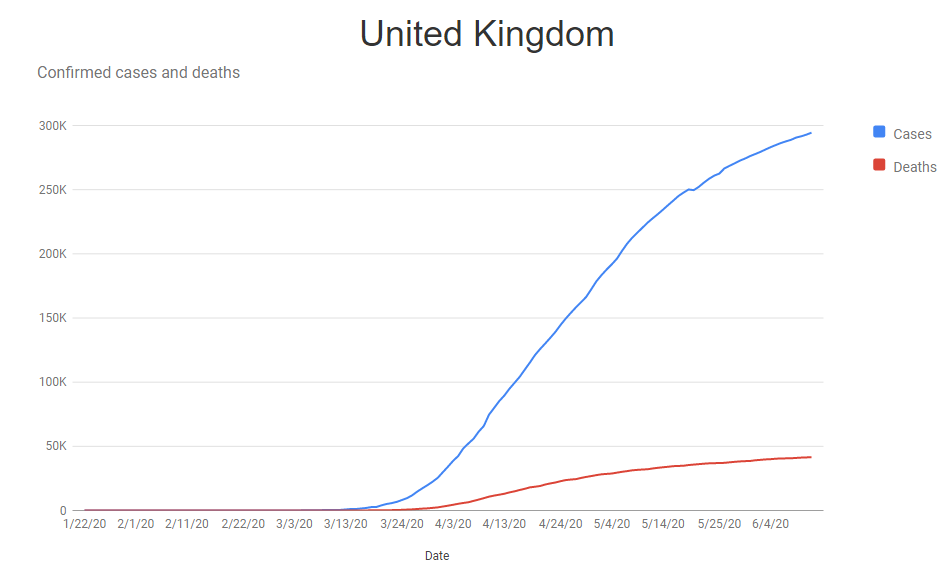
This a simple webapp put together for personal use of me and my family in order to address the fact that most site with Coronavirus statistics seemed to prioritize visuals over accessibility of data.
It is as simple as it gets - couple of times a day this webapp fetches data from John Hopkins repository and presents them in an easily sortable table of individual country statistics. After clicking on the country name we gain access to plots created with Google Charts.